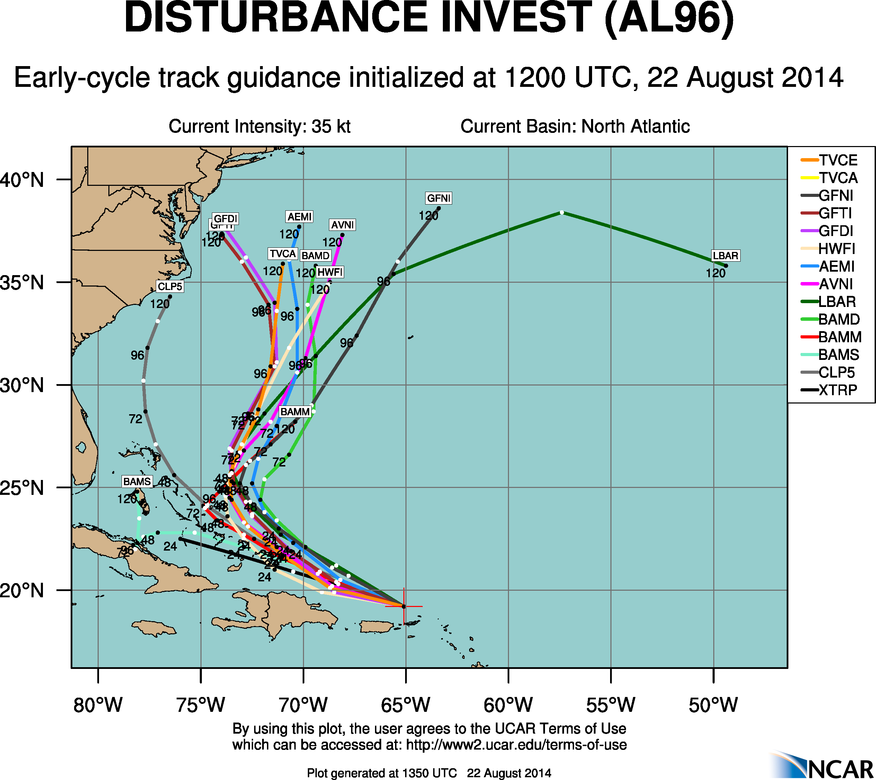
Tropical wave 96L is currently moving west-northwest over Puerto Rico this morning. Another reconnaissance flight is scheduled to fly into the system this afternoon. But it is difficult to discern a closed surface circulation with surface observations and satellite imagery this morning. Strong shear from upper-level trough over the Western Atlantic is enhancing a large area of convection that stretches from the Northeast Carribean Sea to the Southwest Atlantic. This shear along with some land interaction with Puerto Rico and Hispaniola, will likely inhibit further development into a tropical storm through the day tomorrow.
On Sunday this system will steered northward into a weakness in ridge over Western Atlantic. At this point, the environment may become more favorable for further development. It will be over warmer waters and the current trough may lift out enough for shear to relax. After this period, the track becomes more uncertain. Another trough will be digging over the Western Atlantic. Some models show this trough fully capturing 96L and quickly recurve it out to sea. Other models show this trough leaving behind 96L and turn it back towards the west or northwest again. However, this would likely be temporary as most models also show a strong ridge building over the Eastern US next week, that would block further movement west or northwest from 96L.
Overall in my opinion, the pattern doesn’t look favorable 96L to make landfall along the East coast as significant tropical system. Tropical storms and hurricanes often take the path of least resistance. Which appears to be over the Western Atlantic next week, between stronger blocking ridge over portions of the Eastern United States and over the Central Atlantic. However, if next week’s trough to be not as deep or more progressive, this could more allow high pressure to build over the Northwest Atlantic, forcing a track closer to East Coast. Assuming the environment becomes favorable enough for tropical storm to form. At this time, this scenario has a very small chance of happening. But everyone along East Coast, particularly from the Carolinas to New England still need to monitor this storm. Whether not this system threatens the US, large swell from this storm could impact East Coast next week. Another update, will come if they are any major changes or upgrade to tropical storm.
Warmer than normal sea-surface temperatures over Northern Pacific Ocean also known as +PDO (Pacific Decadal Oscilliation), have enhanced ridge over heights over West Coast of North America from time to time. This was has resulted in troughiness over Eastern North America, with virtually no prolonged or extreme heat this summer for Northeast United States. In fact, temperatures have been near or below normal for the last several weeks:
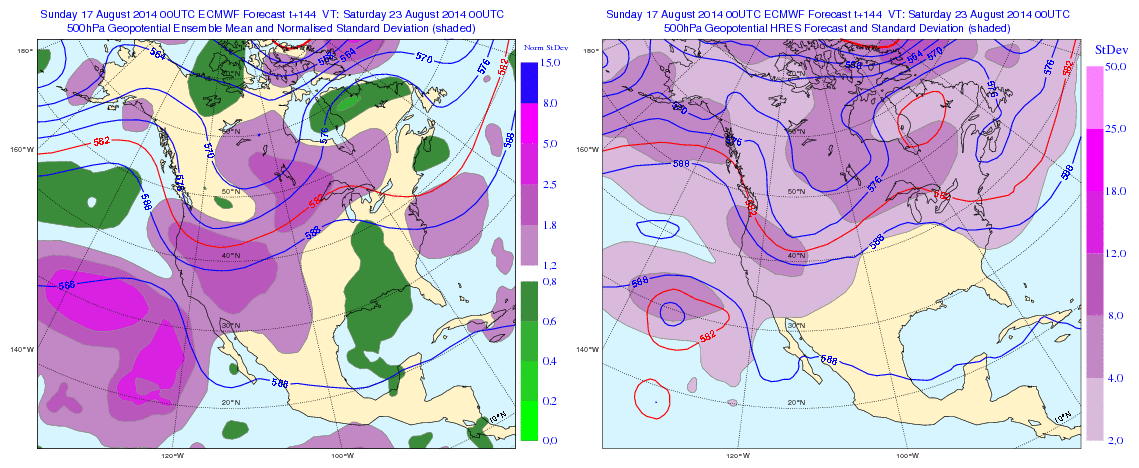
Continuing this theme, the GFS and ECMWF ensemble means for later this week shows at 500mb, shows a Northeast Pacific ridge with heights extending up to Alaska and trough digging into Pacific Northwest. This is a classic -EPO/-PNA pattern. This results in ridge building over Central United States. But the amplification of this ridge into Hudson Bay/Southeast Canada, leads to lower heights over the parts of the East Coast/Western Atlantic. Somewhat reminiscent of an omega block. This supports disturbances to drop down from the north or an onshore flow with high pressure to the north and east:
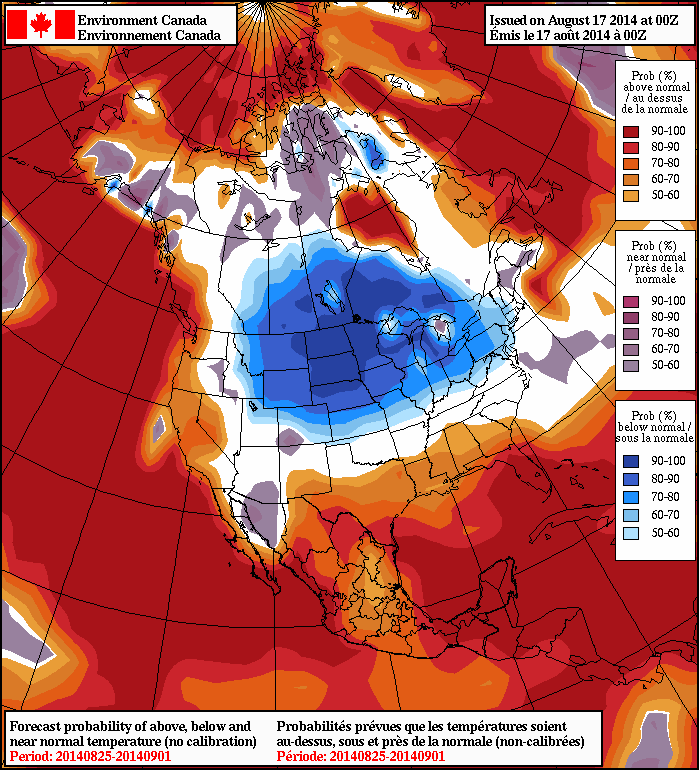
The trough over the Western US will eventually shift eastward, after this period. A brief surge warmth and humidity, may proceed it. But another cooler airmass will likely come behind it. Overnight guidance is starting to pick up on this as well. The 8-14 day outlook from the NAEFS, basically last week of August, now showing 50%> probabilities of temperatures averaging below normal from over the Northern Plains into the Northeast:
09/3/14 Update: An official report on this event was done by the National Weather Service in Upton,NY. It includes 1.08″ of rainfall that was recorded in just 9 minutes! The moist nature of airmass that was being transported over Long Island was extremely anomalous as well. Precipitable water values 2.38″ from climatology data was reported over Wallops,VA, Since 1963, 99% of precipitate water values were below this value. My original report:
Very heavy showers and thunderstorms drenched parts of LI overnight Tuesday and early Wednesday morning. Islip MacArthur Airport, NY received 13.27 inches of rainfall by time it was over. Another thunderstorm later in the afternoon dropped another .30″ of rainfall. For total rainfall of 13.57″ out of this event. That total breaks the all-time record rainfall in 24 hours in New York State. Which was 11.60 inches in Tannersville, NY on Aug. 28-29 2011, during hurricane/tropical storm Irene. For records at Islip Airport, 13.51″ of rain was recorded for August 13th. Which far, far exceeded the record highest rainfall for the date of 0.91″. A rainfall total of 14.03″ for the month so far, also beats the wettest August on record 13.78″ back on August 1990. It’s also very close to the all-time monthly record of 14.07 back in October 2005. The historic nature of these records are tempered somewhat by records only going back to 1984 here. However, at Central Park, which records go back to 1869, only three months have been wetter than at Islip for the month so far. Some other towns not too far away saw double-digit rainfall totals as well. Such as Holbrook with 12.57″ and Bay Shore at 11.35″. More heavy rainfall totals can be found on National Weather Service Upton,NY Public Information Statement.
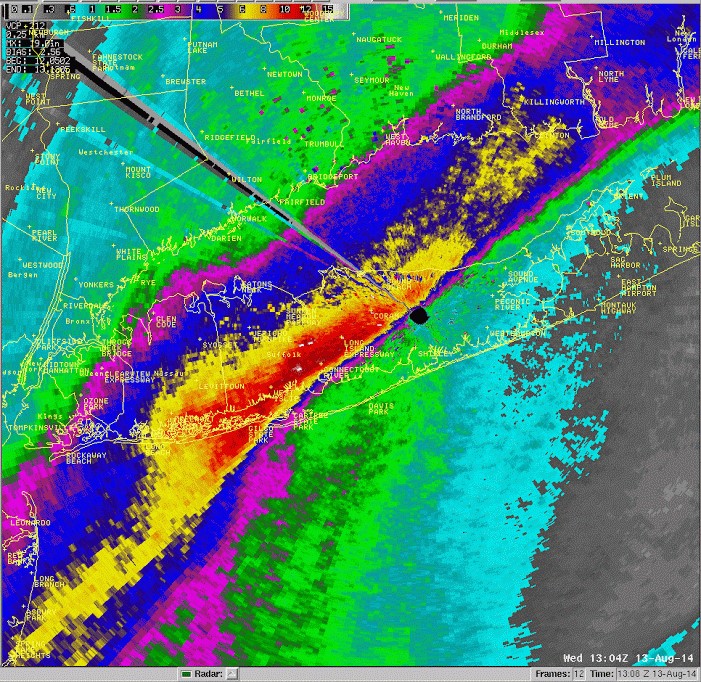
National Weather Service from Upton,NY Dual Pol radar estimates up more than 10″ over SW Nassau County and NW Suffolk County
The most extraordinary note about Islip’s rainfall yesterday, was how much rainfall fell in a very short period. Islip between 5am and 7am, reported 5.34″ in first hour, then 4.37″ in the second hour. For a total of 9.71″ in just 2 hours alone! Rainfall rates like that are very uncommon for this area and more typically seen in tropical cyclones. At this time, I can’t find any information on record rainfall rates for this region. Nor can I recall any storm producing that 4″ to 6″ per hour rainfall rates. This produced a significant amount of flash flooding on roadways and neighborhoods in that area.
There was also a very wide range of rainfall totals across the Tri-State area. More than I originally expected myself. Most prolific rainfall totals, where just along and north of a coastal front that extended from a secondary and triple-point surface low further down the coast into Eastern Long Island. Along and just north this front, deep moist convergence and surface frontogenesis was most enhanced. A middle to upper disturbance juxtaposed with this surface system, also enhanced divergence aloft. Precipitable water values were near 2.00″ and MUCAPE near 500 J/kg. This is resulted in thunderstorms with extreme heavy rainfall rates training over from Southern NJ to West-Central Long Island. Winds were also gusting over 40mph near the shores as well. Highest report was a 57mph thunderstorm wind gust near Robert Moses State Park in Long Island.
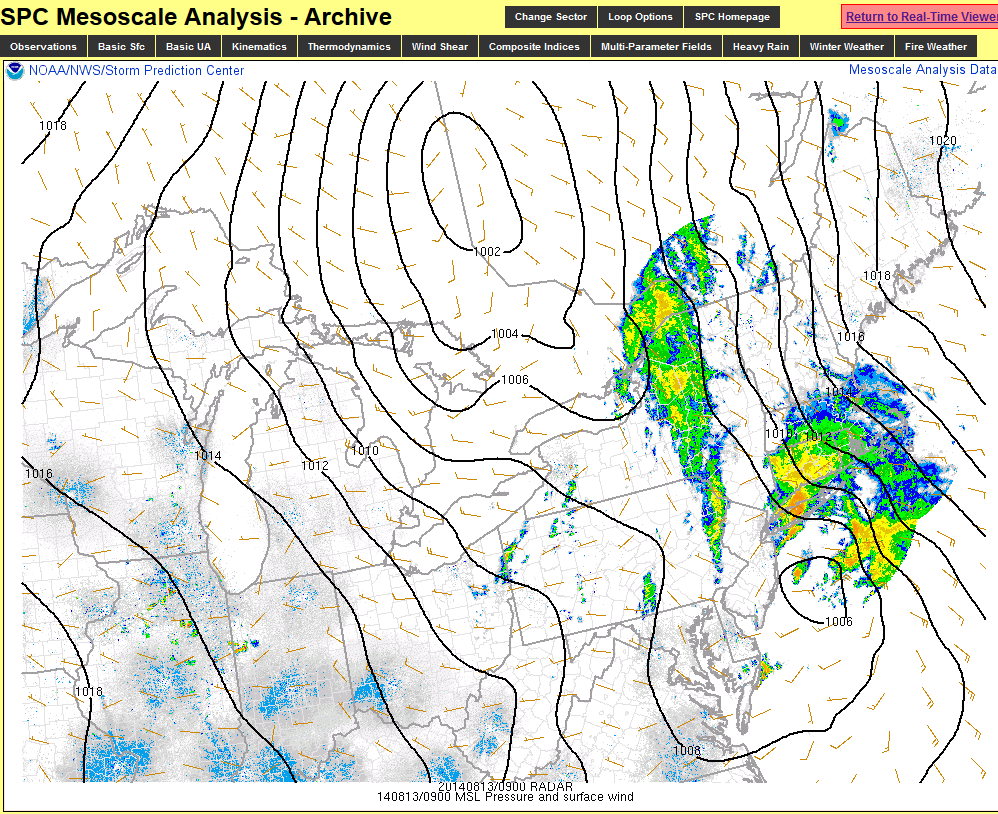
SPC mesoanalysis showing the primarily low over Canada. Secondary low east of NJ causing heavy thunderstorms over Long Island early Wednesday morning.SPC Mesoanalysis showing deep moist convergence and 100mb mixing ratio early Tuesday morning over West-Central Long Island.SPC Mesoanalysis showing surface frontogenesis highest over Central Long Island
With an extreme amount of dynamics focused over these regions, this took alot of energy for heavy rainfall for areas farther inland and further east. Which resulted in far less rainfall. While in my last post, I mentioned there could be localized higher totals with any training t-storms anywhere, I didn’t discuss the possibility that the secondary/triple-point low could rob areas further inland of moisture and dynamics. Most model guidance didn’t not these handle these apsects as well. Therefore the rainfall totals shown on the models where far off for most areas. But that it is not really unusual. It’s always difficult for the models, resolve differences in convective parameters and forcing mechanisms. When accessing heavy rainfall potential, it’s better look for and focus more on synoptic features present on the models. Such as the low-level jet and precipitable water values. That all being considered, I don’t think anyone could of reasonably argued for more than 10 of rain for parts of the area, from a non-tropical system that was relatively progressive for our area.
 On Sunday this system will steered northward into a weakness in ridge over Western Atlantic. At this point, the environment may become more favorable for further development. It will be over warmer waters and the current trough may lift out enough for shear to relax. After this period, the track becomes more uncertain. Another trough will be digging over the Western Atlantic. Some models show this trough fully capturing 96L and quickly recurve it out to sea. Other models show this trough leaving behind 96L and turn it back towards the west or northwest again. However, this would likely be temporary as most models also show a strong ridge building over the Eastern US next week, that would block further movement west or northwest from 96L.